Modeling data in Property and Casualty Insurance
Contents
Data structure and granularity
Claims and policy mid-term changes
Introduction
Nowadays Predictive modeling is widely used in P&C insurance companies for underwriting/risk selection etc. You can google a lot of information from scholar papers to Kaggle competitions.
However, you hardly find any guidance how to build a data set for modeling. All papers mention a lot of available variables in P&C Insurance but not how to arrange the data.
What level of granularity should we use in the model dataset? Individual risk or policy level? Policy, policy term or mid-term changes level? This information is not provided in the papers.
What is Risk? Sometimes it`s easy : building in homeowners or dwelling. How about Auto? Is it a vehicle and primary driver or we need to account for any other driver in the household?
Usually there are more small losses then huge losses (auto). Should we consider this disproportion when preparing a modeling dataset?
There are no perfect data. What should we do with slightly imperfect data? How much is slightly?
I created datasets for modeling in Private Passenger Auto, Homeowners and Dwelling lines and share my thoughts and findings in the article. The details maybe obvious for actuarial people, but not for database developers who know the data and can provide stable and consistent datasets.
Data structure and granularity
Risk
At the very high level the modeling dataset is a combination of policies, risks, and claims data. The number of risks per policy depends on the line of business. In most cases there is just one risk per policy in Homeowners and Dwelling (building) and several vehicles and drivers in Auto. In some cases, it`s possible to have more than one building in Dwelling at the same moment of time or different building in different time periods in Homeowners but they are still just separate buildings in contrast to Auto where possible to have different combinations of vehicles and drivers, permitted drivers, not registered in the policy, or rented vehicles.
So, each line in the modeling data represents:
- Building in Homeowners and Dwelling with some unique identifiers which building is it (address, building number)
- Vehicle and assigned driver combination for Auto with unique identifiers (VIN, Driver License, vehicle number and driver number)
No need to add unique identifiers to the training and testing data or used as predictors. The purpose is to assigned proper risk characteristics and do testing and filtering.
Adding proper vehicle and assigned drivers combinations can be a big issue depending on how clean or messy the source system is. It`s possible to have duplicate VINs in a policy as well as duplicate or double assignments.
A transactional system may allow to add not just primary assigned drivers but also primarily or occasional. For some types of analysis (multivariate e.g., GLM or XGBoost), a researcher may need not just primary assigned drivers but also any possible combination of vehicles and drivers in a policy to get proper characteristics of risks to include in a model.
Mid-term change
Risk attributes and the potential adherence to a loss can be changed mid-term. So, the natural granularity of the modeling dataset is a mid-term change. What`s a mid-term change? It`s a transaction in the system after a policy Renewal (or New Business) but before a new term effective date or cancellation. Usually, Endorsement transactions change risks attributes and associated policy premium.
Depending on a transactional system it can be a problem to identify valid mid-term changes. Endorsement transactions can change anything in a policy even not related to the selected risk attributes. We do not need a new record in the modeling data if there is a transaction to correct an insured first name, but if it`s a correction of a drivers date of birth (age) then it should be recorded.
One of the ways, to select only needed transactions is to check if there is a change in a policy premium comparing to the previous policy state. If there is a change then most likely an important rating variable was changed and it impacted the premium.
There is always a chance to loss the premium change if several changes were combined into one transaction: some changes increase the premium and the other are discounts. In addition, the values of attributes itself can be checked for a change.
Technically, several transactions can be effective on the same day. A policy automatic renewal is added in the system 2 months in advance. But it`s possible an immediate endorsement is issued with the same effective date as the renewal transaction during these 2 months or on the first effective date. If the duration of the midterm change is too short (less than a day) we do not include this change in the data.
On the other hand, if there are mid-term changes starting in one calendar year and ending in the next, we separate them into 2. Each line in the model data is attributed with Calendar Year which is the year of the mid-term start date. Calendar Year helps to divide data into training/validation/test sets later in the process.
Corresponding Written and Earned premium as well as calendar year exposures are added for each mid-term change.
In a simplified version, strictly 1-year exposures are the base for the modeling data.
Claims and policy mid-term changes
Policy and claims data are different entities which can be stored not just in separate tables but even in different databases and transactional systems. You should not expect a proper database relation (foreign and primary keys) between these two objects. Usually premium and losses are joined at a different, higher level, then it`s required for the modeling data. It can be monthly, line of business, state aggregations but not individual policies or risks.
Policy Number or policy term ID most likely is the part of a claims database. To get a proper mid-term change you need to use Loss Date. Both claim attributes are not static thru the life of a claim. A wrong loss date or policy term can be automatically added via a data feed or manually and corrected later. It`s important to use the latest known claim data in the joining process. Sometimes the errors are still in the claim database and there is a mismatch between a correspondent policy term Effective and Expiration dates and a claims Loss Date.
The other problem is joining claims to a specific risk in a PersonalAuto policy. Unknown vehicle and/or driver in the claims database is not always an issue but can be a natural claim feature. A claim can be related to a rented vehicle. A rented vehicle is not part of the policy database and no additional info (risk characteristics) is available in a claim. Even when a vehicle is known, a driver can be unknown in the policy database but permitted by an owner to use the vehicle or not relevant to a claim (parked vehicle).
We use a policy Vehicle Number 1 and Driver Number 1 as a default vehicle and driver when both are unknown and assigned vehicle or driver if at least one is known in the claim database. But because for some analysis these claims are not relevant it`s important to flag such replacements for filtering.
PersonalAuto claims may involve more than one vehicle. A claim automatically created by a data feed may have populated a wrong column (``other party`` instead of ``insured vehicle``) with a known vehicle VIN number from a policy. It`s a good idea to research all related tables before use default values in the modeling data.
There is a straightforward way to join a correct risk from a policy database in most Homeowners and Dwelling claims. However, some claims like a theft from a vehicle may not have any risk identification in a claim database.
Policy level attributes can be easily added in such structures since the data are at the mid-term basis. But claims info (incurred loss and claims counts) is aggregated because we may have more than 1 claim per the same mid-term change.
Coverages
Coverages and Line of Business also impact the data structure because of the different importance and ways of data analysis in different lines.
Each mid-term change/record in PersonalAuto modeling data is for a specific coverage. On the opposite, we do have coverage related data (premium, losses) in columns in Property modeling data. In addition, losses are aggregated not just by coverage but also on perils and catastrophe basis in Property data. Cause of loss is not so important for PersonalAuto analysis and catastrophe claims are rare in this line of business. That`s why they are just additional columns in PersonalAuto modeling data. In this way catastrophe losses can be easily separated.
Some similar coverages can be grouped under the same name. It`s possible when essentially the same coverages have different codes in different products in the same lines or from different transaction systems if we extract data from a retired one and a current.
PersonalAuto data are often analyzed for specific limits combinations. That`s why for easy filtering we have BI and some other limits in each record even if it`s another coverage dataset record.
Predictors
There are hundreds of available variables describing a risk. Most of them are categorical with many levels and require conversion. They are coming from insured, agents, vendors data report, underwriters, etc
|
AllPerilDeductible |
Gatedcommunityind |
RentersInsurance |
Stories |
|
BurglaryAlarmType |
Homegardcreditind |
ReplacementCostDwellingInd |
Tenantevictions |
|
ConstructionCd |
KitchenFireExtinguisherind |
Replacementvalueind |
Units |
|
Deadboltind |
NeighborhoodCrimeWatchInd |
RoofCd |
UsageType |
|
DeluxePackageInd |
Numberoffamilies |
SafeguardPlusInd |
WaterDeductible |
|
Equipmentbreakdown |
OccupancyCd |
SecondaryResidence |
WaterDetectionDevice |
|
FireAlarmType |
OrdinanceOrLawPct |
Serviceline |
WaterRiskFreq |
|
FireHazardScore |
Poolind |
SmokeDetector |
WaterRiskSeverity |
|
FireLineAssessment |
PropertyManager |
Sprinklersystem |
WUICLASS |
|
FunctionalReplacementCost |
ProtectionClass |
SqFt |
YearBuilt |
Table 1 Sample variables for Property risks (Dwelling and Homeowners)
|
acci_pointschargedterm |
drivertypecd |
newteenexpirationdt |
|
Acci5yr, Acci7yr |
gendercd |
newtostateind |
|
birthdt |
gooddriverind |
occupationclasscd |
|
driver |
licensedstateprovcd |
other_pointschargedterm |
|
driverage |
licensedt |
scholasticdiscountind |
|
driverinceptiondate |
licensenumber |
susp_pointschargedterm |
|
driverlicenseage |
maritalstatuscd |
viol_pointschargedterm |
|
drivernumber |
maturedriverind |
|
|
driverstatuscd |
mvrstatus |
|
|
DriverTrainingInd |
mvrstatusdt |
|
|
Annual_Mileage_Estimate |
Last_Owner_Recent_Annual_Mileage |
restraintcd |
|
antitheftcd |
manufacturer |
titlehistoryissue |
|
AverageMileage |
medicalpartsaccessibility |
vehbodytypecd |
|
CaliforniaRecentMileage |
mileage |
vehicleinceptiondate |
|
daysperweekdriven |
ModeledAnnualMileage |
vehusecd |
|
Estimated_Current_Mileage |
modelyr |
vin |
|
estimatedannualdistance |
neworusedind |
weekspermonthdriven |
|
estimatedworkdistance |
odometerreading |
|
|
Last_Owner_Average_Miles |
performancecd |
|
|
Last_Owner_Government_Recent_Annual_Mileage |
RecentAverageMileage |
Table 2 Sample variables for Auto risks (PersonalAuto)
Here are some issues to research and resolve before adding a potential attribute into the dataset:
1. Empty or None values
a. A variable is recently added in the system and there is not enough history
b. Some attributes available only for a specific product or state. They are not populated in other states or products even in the same line of business
c. The same attribute may be stored in a different database tables or columns depending on product/release.
2. Not consistent values in the same attribute:
a. Data migrated from a former transactional system can have a different set of categories
b. Classification codes change over time and states
c. Adjusting made in the same system over time
d. 3rd party systems may provide the same information in a different way in a past or depending how it was requested: regular updates on renewal or one-time request for the whole book of business.
e. Free form text input in a transactional system instead of a drop-down list with predefined values
3. Wrong data stored in the database because of missing validation in a transactional system: a driver license date before a date of birth, date of loss before policy in effect etc.
Some of the questions above can be resolve easily using simple SQL but the others may require long communications with IT developers, analysts, product managers. Data Catalog tools can replace such tribe knowledge and help to identify the potential data sources. It`s also much easy to build the modeling data based on a data warehouse system when most if not all attributes are already identified and stored in risk item dimensions as DIM_BUILDING, DIM_VEHICLE, DIM_DRIVER.
Another group of variables is calculated attributes. We may not have them ``as is`` in a table in transactional or data warehouse system but they can be pre-calculated based on other related data. As an example, the total number of insured properties/policies in a company per insured. For PersonalAuto analysis important to have number of active vehicles, drivers, non-drivers, excluded drivers , young drivers at each midterm change. PersonalAuto policies may have only liability coverages and others only Comprehensive coverage. These policies can be flagged in the data.
Some policy level attributes like discounts or inception dates are also included in the modeling data. They are usually more robust and consistent comparing to risk attributes. Its discussable if limits and deductibles should be included in models as features in the final datasets but they may be needed for filtering. Policy Numbers and policy term IDs, effective and expiration dates are unique and adding them in the models will produce a random effect. If our final interest to produce estimates for each policy, then policy numbers and policy term IDs are must have in the modeling data but maybe not in training dataset. But think about correlation between multiple renewals of the same policy included in the dataset. A researcher may wish to include policy term IDs specifically for this random effect. The rest of the policy level attributes (agency, product, company etc.) are useful for special research filtering.
|
Policy Number |
Inception date |
|
Policy Term ID |
Persistency Discount date |
|
Effective date |
Multi Policy Discount |
|
Expiration date |
Multi Car Discount |
|
Company |
Employee Discount |
|
Carrier |
Late fee |
|
Policy New or Renewal |
Agency |
|
Renewal Term |
Agency Group |
Table 3 Sample attributes at policy level
What attributes to include in the modeling data depends on the final purpose. Everything can be included in a general purpose or only selected for a specific research.
External data
A wide variety of data are available and can be included in a research.
- Demographic data
- Credit history
- Police reports
- Criminal history
- Social-media
I would not include this type of data in a general-purpose modeling dataset. Instead, I would save the data in separate tables and describe in a Data Catalog tool the ways how to join the external data and a modeling dataset.
Since Insurance is a highly regulated business there is always a chance the external data are not supported by a regulator. For example, using in modeling social-media usage habits (other than phone use while driving) is prohibited in Nevada. The rules are specific for each state. It may be a good idea to add comments in a Data Catalog tool for each external dataset if its allowed to be used and for what kind of models.
Target variable
A general-purpose modeling data can have several target variables.
- Pure premium
- Claim frequency
- Claim severity
- Binary category claim/no claim
- Binary category Large Loss/No Large Loss
Since the analysis can be done for a specific type of coverage, the target variables should be separated for each coverage.
Each peril (or group) can be modeled separately and the targets should allow to model on perils basis.
Catastrophe losses are modeled separately from other type of losses. That`s why a researcher should be able to separate target variables based on a catastrophe flag.
Mix of small and very large losses impacts the result of modeling. If it`s the case, like in PersonalAuto line, capping losses at some thresholds can help to create more stable models. A threshold should be set at a point to discover a systematic part, but not too high to capture noise from large losses.
|
Column
suffix |
Condition |
Threshold |
|
_le500 |
Loss Less or Equal |
500 |
|
_1000 |
Loss Greater then |
1,000 |
|
_1500 |
Loss Greater then |
1,500 |
|
_2000 |
Loss Greater then |
2,000 |
|
_2500 |
Loss Greater then |
2,500 |
|
_5k |
Loss Greater then |
5,000 |
|
_10k |
Loss Greater then |
10,000 |
|
_25k |
Loss Greater then |
25,000 |
|
_50k |
Loss Greater then |
50,000 |
|
_100k |
Loss Greater then |
100,000 |
|
_250k |
Loss Greater then |
250,000 |
|
_500k |
Loss Greater then |
500,000 |
|
_750k |
Loss Greater then |
750,000 |
|
_1M |
Loss Greater then |
1,000,000 |
Table 4 Example of capping claim losses in PersonalAuto model data
|
Based on perils: |
There is an attribute based on these categories for each
coverage group* |
Peril |
|
Non-Catastrophe Water |
cova_il_nc_water |
Flood, Water Backup, Water Damage, Water Discharge |
|
Non- Catatastrophe Wind & Hail |
cova_il_nc_wh |
Hail, Windstorm |
|
Non- Catatastrophe Theft &
Vandalism |
cova_il_nc_tv |
Theft, Theft From Unattended Auto, Vandalism
Malicious Mischief |
|
Non- Catatastrophe Fire &
Lightning |
cova_il_nc_fl |
Fire, Lightning, Smoke |
|
Non- Catatastrophe All Other |
cova_il_nc_ao |
NOT in (Flood, Water Backup, Water
Damage, Water Discharge, Hail, Windstorm, Theft, Theft From
Unattended Auto, Vandalism Malicious Mischief, Fire, Lightning, Smoke) |
|
Catatastrophe Fire
& Smoke (i.e., Wildfire) |
cova_il_cat_fire |
Fire, Lightning, Smoke |
|
Catatastrophe All
Other |
cova_il_cat_ao |
NOT in (Fire, Lightning, Smoke) |
Table 5 Example of grouping claim losses for CovA in Property model data
Imperfect data
Deep understanding of your data reveals how imperfect they are. In some cases, more research is needed to fix an issue but sometimes it`s just the matter of fact. People makes mistakes in the process of entering data or a program code populates wrong fields in a database. Even if an issue discovered later it`s too costly to fix historical data.
There is also a question if it`s a data issue or feature. Does it happen only in a specific product or claim type? Maybe it`s expected and default values can substitute missing.
High percent of wrong values in an attribute is a reason to revisit the source of the data or a way how it`s calculated. If nothing can be done then, of course, better not to include the attribute in the final dataset. If there are 5-6% of imperfect or suspicious values (and usually it happens for known products/states/time periods) it may be more costly to fix then exclude them completely. The other way is to keep them in the dataset but flag as an error/issue. If the attribute is a major one for a research, the records can be easily filtered out.
Quality flags can be part of precalculated data in DW tables and excluded from the process from the beginning or transferred to the final dataset. The flags help to test the data and estimate quality in general.
|
Flag |
Meaning |
|
Policy History inconsistency |
Some manual updates changed the consistency of policy history |
|
Risk duplicates |
There is more than one active risk with duplicate numbers or
other attributes exist at the same time in a policy |
|
Excluded driver |
Excluded drivers in our system have the same IDs. If there is a
claim for an excluded driver it is not possible to assign to a proper driver.
The number of excluded drivers also can be affected |
|
Replaced vin |
A vehicle was not set as "Deleted" but rather replaced
with another vehicle (VIN). It may create wrong mid-term changes for
vehicle-driver pairs |
|
Replaced driver |
A driver was not set as "Deleted" but rather replaced
with another driver (driver licensed was changed) |
|
Claim with unknown VIN |
A claim with Unknown VIN in the system |
|
Claim with unknown VIN and driver |
A claim with Unknown VIN and a driver not in the system or
missing |
|
Claim policy term join issue |
A claim is assigned to a first record in a policy term due to
issues in a related policy term ref and/or loss date. |
Table 6 Quality flags
Final Database Structures
We created 2 general purpose modeling datasets with different structures:
- Auto modeling data based on PersonalAuto line
- Property modeling data based on Homeowners and Dwelling lines
The datasets available to users are views based on fact tables and dimensions in DW. The views can be used ``as is`` or a new , more specific for a project structure can be built based on fact and dimensional tables. An additional info, like demographic data or 3rd party vendors data can be easily joined if needed.
The fact tables are policy risks mid-term changes with policy premiums, exposures, claims count and losses as measures. FACT_AUTO_MODELDATA combines individual coverages data in rows (coverage codes, premiums, losses in each row). It`s a very long table. FACT_PROPERTY_MODELDATA has the coverage related data in columns. It`s a very wide table.
Dimensions are policy and risk data. They are conformed slowly changing dimensions type 2.
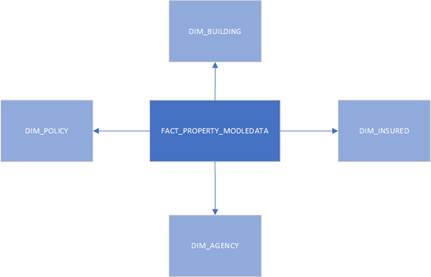
Image 1 Property Modeling Data schema
Fact_Auto_Modeldata combines only vehicle and primary driver IDs. If it`s needed, the structure can be extended with primarily and occasional drivers related to the same vehicle_id in the fact table via DIM_RISK_EXTENSION. It should be done with caution because written and earned premium are only for risks based on primary drivers.
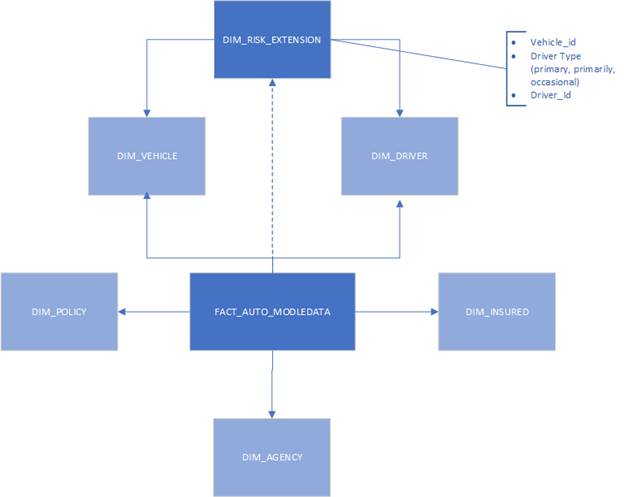
Image 2 Auto Modeling Data schema
There are hundreds of columns in the final views. The tables below show only major groups of fields in the views with some examples to better understand the structure.
|
Area |
Attribute
Name |
Comment |
|
Agency |
ProducerName |
Agency name, code, status |
|
Building |
RoofCd |
Building attributes (yearbuilt, usage,
construction) |
|
Claims |
AllCov_LossInc |
Claims counts and losses for a specific policy risk (building)
and mid-term change grouped by coverage, peril, and catastrophe |
|
Claims |
AllCov_LossDCCE |
|
|
Claims |
AllCov_LossALAE |
|
|
Claims |
covA_il_nc_water |
CovA incurred
losses (non-catastrophe) , water peril |
|
Claims |
covA_il_nc_wh |
|
|
Claims |
covA_il_nc_tv |
|
|
Claims |
covA_il_nc_fl |
|
|
Claims |
covA_il_nc_ao |
|
|
Claims |
covA_il_cat_fire |
|
|
Claims |
covA_il_cat_ao |
|
|
Claims |
covB_il_... |
|
|
Claims |
covC_il_... |
|
|
Claims |
covD_il_... |
|
|
Claims |
covE_il_... |
|
|
Claims |
covF_il_... |
|
|
Claims |
liab_il_... |
|
|
Claims |
..._dcce_nc_water |
dcce |
|
Claims |
..._alae_nc_water |
alae |
|
Claims |
covA_ic_nc_water |
incurred count |
|
Claims |
covD_ic_cat_fire |
catastrophe related |
|
Coverage |
CovA_WP |
CovA - CovF mid-term change written premium |
|
Coverage |
CovA_EP |
CovA - CovF mid-term change earned premium |
|
Coverage |
covA_deductible |
CovA - CovF deductible |
|
Coverage |
covA_limit |
CovA - CovF limit |
|
Insured |
InsuranceScore |
Insured Attributes (scores) |
|
Mid-Term Changes |
cal_year |
Year of Start Date |
|
Mid-Term Changes |
startdate |
Exact Mid-Term Start date or Jan 1 next year if a mid-term
covers more than one year. |
|
Mid-Term Changes |
enddate |
Exact Mid-Term End date or Dec 31 if a mid-term covers more than
one year. |
|
Mid-Term Changes |
startdatetm |
Exact Mid-Term Start date (transaction effective date) |
|
Mid-Term Changes |
enddatetm |
Exact Mid-Term End Date (next transaction effective date) |
|
Mid-Term Changes |
ecy |
Calendar Year Exposures: difference between StartDate and EndDate divided by 365.25 |
|
Policy |
policynumber |
Policy Attributes |
|
Quality |
excludeddrvflg |
Quality flags |
|
Testing/ProofOfConcept |
HasCreditCardPaymentByInsured |
Some calculated attributes |
Table 7 Property Model data attributes (view columns)
|
Group |
Attribute
Name Sample |
Comment |
|
Agency |
ProducerCode |
Agency name, code, status |
|
Claims |
cov_claim_count_le500 |
Claims capped counts and losses for a policy risk (vehicle and
driver) , coverage, mid-term change. AtFault or not
flag |
|
Coverage |
coverage |
Coverage Code (PD, COMP, COLL, BI) |
|
Coverage |
wp |
Coverage mid-term Written Premium |
|
Coverage |
ep |
Coverage mid-term Earned Premium |
|
Coverage |
Limit |
Coverage limits |
|
Coverage |
Deductible |
Coverage deductibles |
|
Coverage |
comp_deductible |
Specific
coverage limits and deductibles for filtering |
|
Coverage |
bi_limit1 (umbi,pd) |
|
|
Coverage |
bi_limit2 (umbi,pd) |
|
|
Driver |
driver |
Driver attributes (age, points, etc) |
|
Insured |
InsuranceScore |
Insured Attributes (scores) |
|
Mid-Term Changes |
cal_year |
Year of Start Date |
|
Mid-Term Changes |
startdate |
Exact Mid-Term Start date or Jan 1 next year if a mid-term
covers more than one year. |
|
Mid-Term Changes |
enddate |
Exact Mid-Term End date or Dec 31 if a mid-term covers more than
one year. |
|
Mid-Term Changes |
startdatetm |
Exact Mid-Term Start date (transaction effective date) |
|
Mid-Term Changes |
enddatetm |
Exact Mid-Term End Date (next transaction effective date) |
|
Mid-Term Changes |
ecy |
Calendar Year Exposures: difference between StartDate and EndDate divided by 365.25 |
|
Policy |
policynumber |
Policy Attributes |
|
Quality |
excludeddrvflg |
Quality flags |
|
Vehicle |
VIN |
Vehicle attributes (year, model, annual distance, etc) |
Table 8 Auto Model data attributes (view columns)
There are complete datasets in the fact tables but views do not include recent 2 months to give some time for claims development.
Monthly snapshots are created to reproduce history if needed.
Data refresh
From a DW developer point of view, the main issue in the transactional system is back dated transactions when a today`s transaction updates something in a past. The oldest update I found is for 7 years back.
The data in the modeling data fact tables are refreshed daily in full. This is the most accurate up to date source of the data in the system. As for now, the full refresh is not the longest process in ETL. But if needed, it`s possible to limit daily refresh to the latest year or two and lost some history.
A full refresh is not an option for conformed dimensions. There are already links to the dimensions from other fact tables which are refreshed incrementally. The workaround is discussed here.
Conclusion
Datasets created specifically for modeling became very popular between actuaries and analysts not just for modeling purposes but also for other projects.
The structures are complex and required detail description of how it was built and how it can be extended with other data available in the system. Examples of frequently asked questions from users:
- How losses were aggregated?
- Is coverage XYZ included in Liability Coverage group?
- How to add one more attribute from DIM_BUILDING?
- Why a N policy mid-term change is not included?
Predictive models filed for review to state regulators must be thoroughly documented. They look at the details and have standards regarding information required as support for models. Here are few support raw input data requirements from State of Nevada:
- The company should provide a list of the input variables that were used in the model
- The company needs to specify timeframe to which the data apply
- The company needs to identify the jurisdictional scope of the data (state-specific, countrywide etc.).
- The company needs to specify the book of business included in the model`s input data (private passenger auto, home, etc.).
- If third-party data were used, the company should identify who the third party is and how customers can obtain and correct any errors that might be discovered in the data.
- Underlying data for the model should include Earned Premium/Losses/Number of Policies
- How did the company address the lack of credible data for any segments that had limited historical experience?
A data catalog tool comes in handy to manage modeling datasets, answer questions, document models.